Faster U.S. growth and widening interest rate differentials helped lift the U.S. dollar in 2018. Whether that trend continues or reverses in 2019 will heavily influence the relative attractiveness of international assets—EM assets, in particular.
Faster U.S. growth and widening interest rate differentials helped lift the U.S. dollar more than 8% on a broad trade‑weighted basis in the first 10 months of 2018. Whether that trend continues or reverses in 2019 will heavily influence the relative attractiveness of international assets—EM assets, in particular.
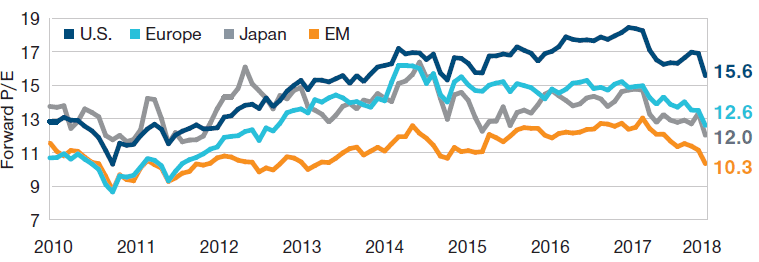
U.S. equity valuations may appear high compared to Europe, but sector differences can help to explain the valuation gap.
As of the end of October, U.S. equity valuations appeared relatively high compared with those in Europe, Japan, and the emerging markets—especially the latter. However, differing sector weights also need to be taken into account, Giroux says. The U.S. market, with its large technology, health care, and business services sectors, tends to sell at a higher average price/earnings (P/E) ratio than most European markets, which have smaller tech sectors and tend to be more heavily weighted with financial stocks that typically feature lower P/E multiples. Adjusted for sector mix, relative valuations between the U.S. and Europe appear to be within historic norms, Giroux adds. “Maybe you can still make the argument that Europe is earlier in the cycle and thus more attractive, but it’s not just because of valuations.”
Relative to their own history, U.S. equity valuations do not appear excessively rich, Giroux says. As of mid‑November 2018, the S&P 500 Index was trading at roughly 15.5 times expected forward earnings, within range of the 20‑year historical average of 15.9. However, with the U.S. moving into the later stages of the business cycle, that multiple might be less attractive than the long‑term average would suggest, he cautions. “What we’ve typically seen is that once you hit an earnings peak, it can take between three and five years to get back to that peak,” Giroux observes. “So, the S&P 500 might actually be selling at 15.5 times 2024 earnings, which is saying something very different.” Boosting the appeal of EM assets, in Thomson’s view: extremely undervalued EM currencies.
U.S. EQUITY VALUATIONS APPEAR HIGH VS. REST OF WORLD 12-Month Forward Price/Earnings Ratio As of October 31, 2018
Sources: FactSet Research Systems, MSCI, and T. Rowe Price. U.S. = MSCI USA Index, Europe = MSCI Developed Europe Index, Emerging Markets (EM) = MSCI Emerging Markets Index, Japan = MSCI Japan Index.